SAM’S CLUB (WALMART MEXICO)
Automating internal supply orders
From a macro-driven Excel file to a module that generates the purchase orders.
- E2E research
- Process mapping
- Usability testing
- Initiative
- Automating internal supply orders for the 174 Sam’s Club (Walmart) wholesale stores in Mexico.
- My role
- End-to-end Product Designer, responsible for research, design, validation and iteration.
- Timeline
- October 2024 - January 2025.
01.Summary
Every month, the 174 Sam’s Club Mexico wholesale stores ordered the supplies they run on through a macro-driven Excel file passed around by email. Consolidating those orders and generating purchase orders relied on manual work spread across several teams.
I led research and design for a module that automates that process. I mapped an undocumented workflow from 14 interviews with 20 participants across nine teams, designed the solution and validated it in 7 usability tests. The module launched in production and was in the adoption phase when the project closed.
02.Context and problem
Internal supplies are the materials a store uses to operate and never sells to customers: trays, domes, bags and packaging for the bakery and fresh departments. They are operating expenses, not stock for resale.
Each month, the 174 wholesale stores ordered these supplies by filling out a macro-enabled Excel file circulated over email and Teams. The process depended on several teams and on a support team that had shrunk from 16 people to 4.
The problem wasn’t just the file: the whole process was held together by manual work, fragmented follow-up and no visibility.
Ordering supplies took five stages. Operational efficiency, the team that set each store’s budget, updated the catalogue by hand. Internal communications sent it to the four district assistants, who looked after about 45 stores each on average; each assistant passed it on to their stores and followed up until every completed file was back. Operational efficiency then consolidated everything so that replenishment, the team with access to the purchasing system, could run the macros and generate the purchase orders.
Nobody had this process documented. I mapped it through interviews with the teams involved to understand who did what, in which order and how long it took.
The main cost was in consolidating orders and generating purchase orders:
25 h / month
cleaning the consolidated file, checking line by line for empty rows, negative quantities, wrong units or missing stores.
20 h / month
generating purchase orders, work replenishment did because operational efficiency had no system access.
A macro that froze the computer
It required an old version of Office and nothing else could be done while it ran.
“From Monday, November 4 to today, the 14th, I’ve put in 43 hours.”
The file was also shared, so one store could overwrite another. Files arrived incomplete and each category ordered in different units, so entering kilos where pieces belonged was common.
With spending of about 26 million euros a year, some stores had stockouts while others were overstocked at the same time, with no clear way to measure either.
03.My role and who I worked with
I worked with product, developers, business analysts, content design and operations stakeholders. Decisions weren’t made alone: my responsibility was to bring the evidence that steered the discussion.
I led:
- •Planning and running the research end to end.
- •Recruiting and interviewing participants from nine teams.
- •Mapping a process that had never been documented.
- •Turning operational findings into product decisions.
- •Validating the solution with usability testing.
- •Defending decisions with the business using evidence.
My research and design leads mentored me and reviewed the approach and deliverables. That gave me autonomy over day-to-day decisions and the responsibility to defend them with stakeholders.
04.Goals
Primary goal
Automate purchase-order generation to reduce stockouts and show how much budget had been used and how much remained.
Operational goal
Make it viable to move from monthly to fortnightly replenishment.
Research goal
Map the full workflow: teams involved, tools, timings, pain points and dependencies.
Starting hypothesis: replenishing more often would improve supply and budget control at each store.
Solution criteria
- •Orders only within a defined, configurable time window.
- •Automatic consolidation.
- •Automatic purchase-order generation.
- •Forecast-based suggested quantities.
- •Approval flow for budget overruns.
05.Decisions and the evidence behind them
Sources: 14 interviews with 20 participants from nine teams, sessions with product and stakeholders, a review of the operational process, analysis of the Excel file and an understanding of the business rules.
Key findings
- •The process was undocumented and lived in the scattered knowledge of several teams.
- •The operational load fell on a few people manually following up with 174 stores.
- •The shared spreadsheet allowed critical errors: stores overwriting each other, incomplete files, wrong units and invalid quantities.
- •The main bottleneck wasn’t data entry but consolidation and purchase-order generation.
- •Without visibility, stockouts and overstock coexisted with no clear measurement.
I used AI to speed up the analysis of the interviews and generate per-team syntheses and draft findings, always reviewing every result. Because I ran the interviews and took part in the stakeholder sessions, I could quickly spot anything that didn’t match what I had observed and fix it. I also used it to explore design alternatives based on the findings, and some ideas became starting points for discussion with the UX team.
How we framed the problem
The challenge wasn’t digitising a spreadsheet, but redesigning an operational process spread across stores, district assistants, operational efficiency and replenishment.
The project arrived with the assumption that internal supplies would sit inside the existing fresh-produce flow. It made business sense, but it had never been validated with users.
I validated the solution with 7 usability tests across three flows: 4 users on order creation, 2 on approvals and 1 on configuration.
In testing, 3 out of 4 users of the ordering flow couldn’t find the tool where it was. To them, packaging was inventory, not fresh produce. That is why the solution became a dedicated module.
The tests helped make key decisions:
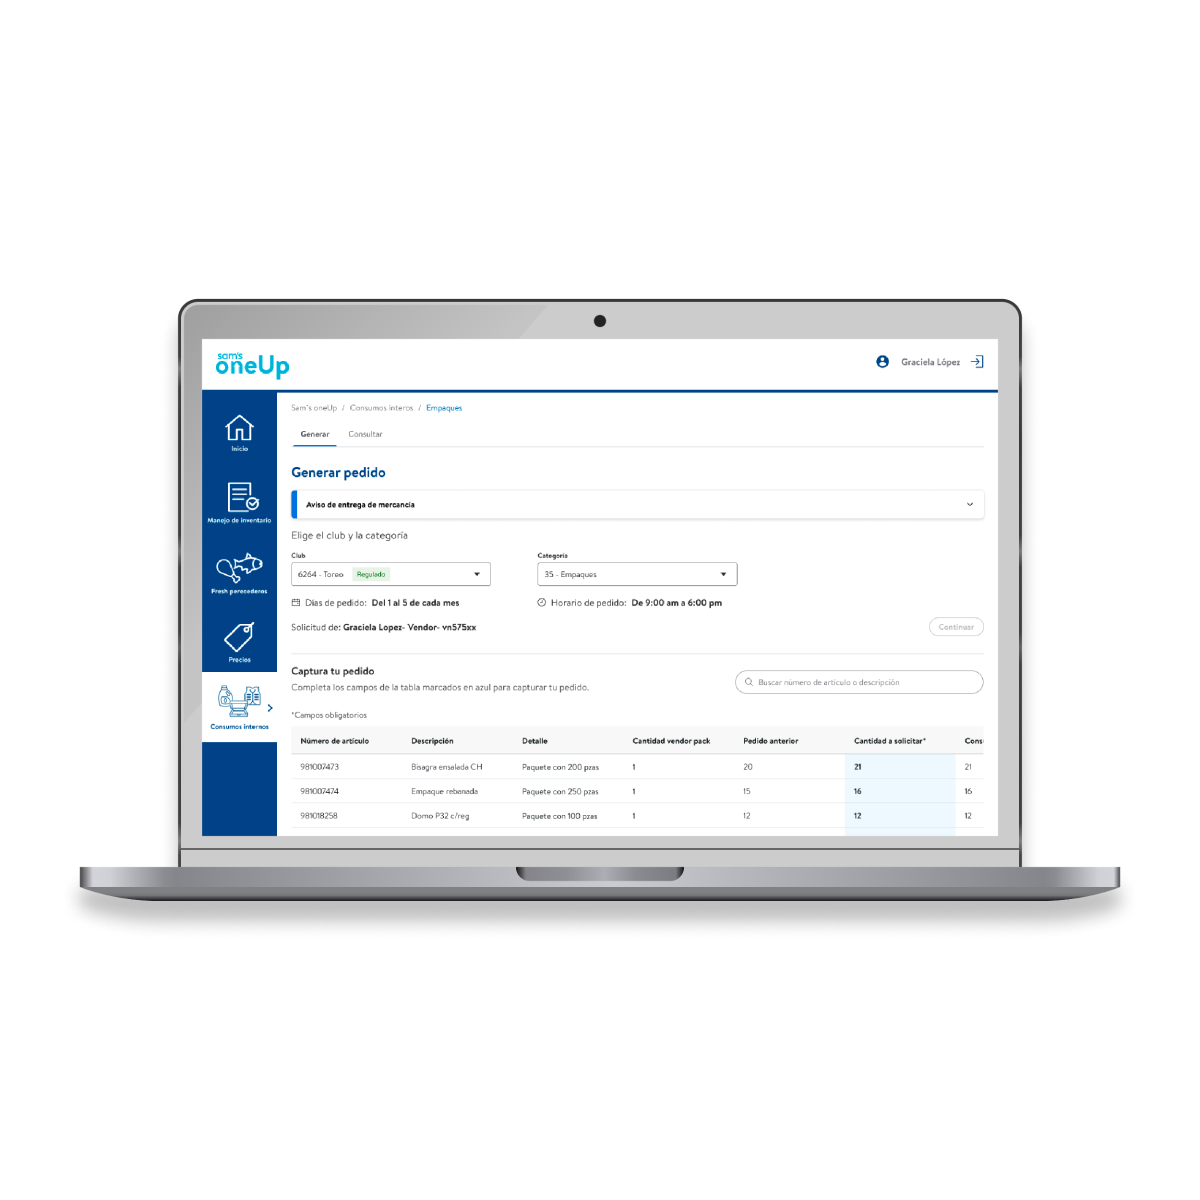
Before, each store calculated its order from last year’s sales, growth trend and a shrinkage target of around 6%. In the solution, the system does that calculation and delivers a pre-filled suggested quantity. Users review it and adjust only where needed.
In testing, “Projected sales” and “Expected consumption” weren’t understood. With content design it became “Suggested consumption (in boxes)”, with a clear name and an explicit unit.
Cells have two states:
- •Light blue: value suggested by the system.
- •Dark blue: value changed by the user.
In a long table, this makes it easy to see what was touched and what was left as it came. The pattern already existed in other modules of the platform, so it built on a learned mental model.
Going over budget was normal and expected: approvals by amount already existed, but they happened over email. The design brought that rule into the product with a tiered approval flow, from store manager up to district deputy director depending on the amount, with the justification visible to the approver.
An order can’t be submitted until it passes validation. Out-of-range items are flagged right in the cell.
06.Limitations and constraints
The test sample was smaller than ideal because of operational availability, so some recommendations were left as future validations.
07.Impact
The module launched in production, bringing the entire process into a digital tool for the first time.
When my involvement ended, the module was in the adoption phase, so this case documents the process design and the decisions behind it, not measured business results.
08.What I learned
Mapping the process changed the conversation more than anything else. It showed the pain wasn’t only in the spreadsheet but in how work was split across teams; without that map, the solution would have just digitised the file.
A requirement can also be an assumption. Using the fresh-produce flow stood for months, and early information-architecture testing would have ruled it out sooner. Even when it comes from product and makes business sense, it needs validating against users’ behaviour and language.
Measurement is part of design. If design isn’t involved in defining metrics from the start, it can be hard to know later whether the available data answers real experience questions.
Researching with people in the middle of operations needs a plan B from day one, like shorter remote sessions or asynchronous exercises.